COMPASS
Collaborative Oceanography and Monitoring for Protected Areas and SpecieS
Sometimes data are too complex. Stories give them form.
During the discussions around Data Management at the November 2020 virtual MPA projects meeting, among the important points made was that as scientists we often get incredibly focussed on details in a very specific field and bringing those details back together with a narrative, with a story, is vital in communicating our results. One highly visual way of doing this is through “Story Maps” that combine interactive spatial data with text and other multimedia to inform and to inspire. Over the 2020-21 winter, the COMPASS project Data Management team have worked with researchers at Afbi and Inland Fisheries Ireland to produce a Story Map highlighting some of the results from the project’s salmonids work package. Find the Story map at: Story Maps | COMPASS Data Portal (arcgis.com)
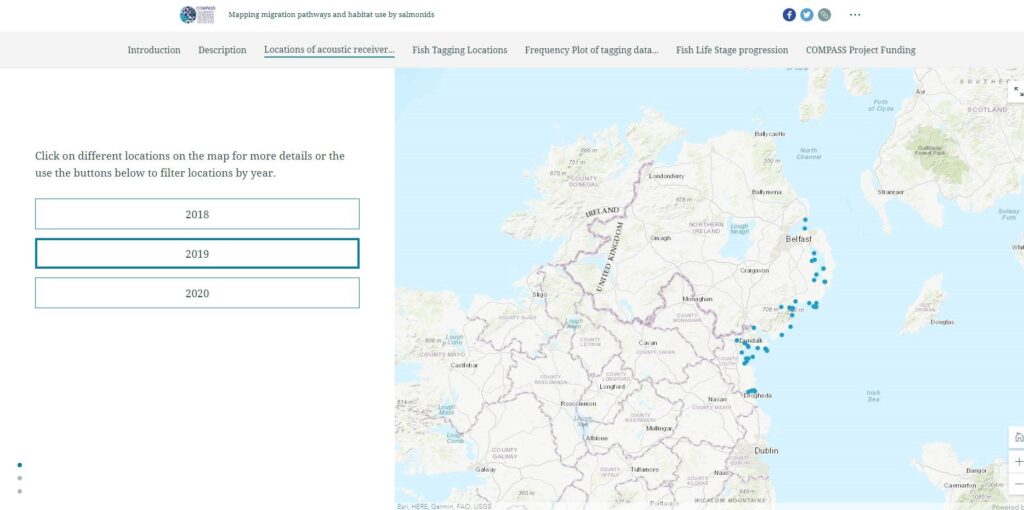
The story map helps to show the progression over 2018, 2019 and 2020 of the locations at which acoustic receivers were deployed in the marine environment to detect fish tagged by the project. The story map also shows the location of year’s tagging activity and details of the fish species and life stage of the fish tagged by catchment during these years. The story map also brings in descriptive text provided by the work package team to describe the fish tagging and data collection process and also includes video of acoustic receiver deployments and fish tagging.
We look forward to producing more story maps to show the progress made on other work packages in the COMPASS project.
- With apologies to the film director Jean-Luc Goddard for misquoting him in the title…